
评估蓄电池的价值以平衡屋顶光伏发电
应用介绍
特斯拉Powerwall家用电池最近的发布在能源领域引起了很高的反响。 许多行业专家预测,此类PV /电池单元将被使用,最终可能会与电网断开连接,从而导致完全自主的家庭或小型电网系统。 这篇的目的是评估在不同假设下比利时系统中7 kWh Tesla电池的盈利能力和潜力。
为了公开起见,选择的格式是开源的Ipython Ipython格式,大家可以对本文的理论假设计算进行验证查看。 输入数据是公共数据,也可以通过csv文件使用。 原始ipynb文件可在此处下载,并允许大家进一步重用/修改/适配自己的项目
加载库和输入数据
import matplotlib.pyplot as plt
import numpy as np
import pandas as pd
import urllib
%matplotlib inline
下载数据
urllib.urlretrieve ("http://www.labothap.ulg.ac.be/notebooks/battery_storage/solar_data.csv", "solar_data.csv")
urllib.urlretrieve ("http://www.labothap.ulg.ac.be/notebooks/battery_storage/demand.csv", "demand.csv")
('demand.csv', <httplib.HTTPMessage instance at 0x7f93b13e65f0>)光伏产量数据是比利时TSO埃里亚(Elia)发布的2014年数据。 该数据是整个比利时地区的汇总数据,主要关注的是系统的昼夜存储能力,而不是快速的分钟变化。 感兴趣的值是太阳能光伏15分钟的可用性因子,通过将测得的产量除以装机容量获得:
solar_data = pd.read_csv('solar_data.csv')
AvailabilityFactor_PV = solar_data['Corrected Upscaled Measurement [MW]']/solar_data['Monitored Capacity [MWp]']
plt.figure(figsize=(20,5))
AvailabilityFactor_PV.plot()
plt.ylabel('Availability factor')
plt.xlabel('Timesteps (15 min)')
plt.title('PV availability factor for Belgium, year 2014')
Out[17]:
<matplotlib.text.Text at 0x7f939b783ad0>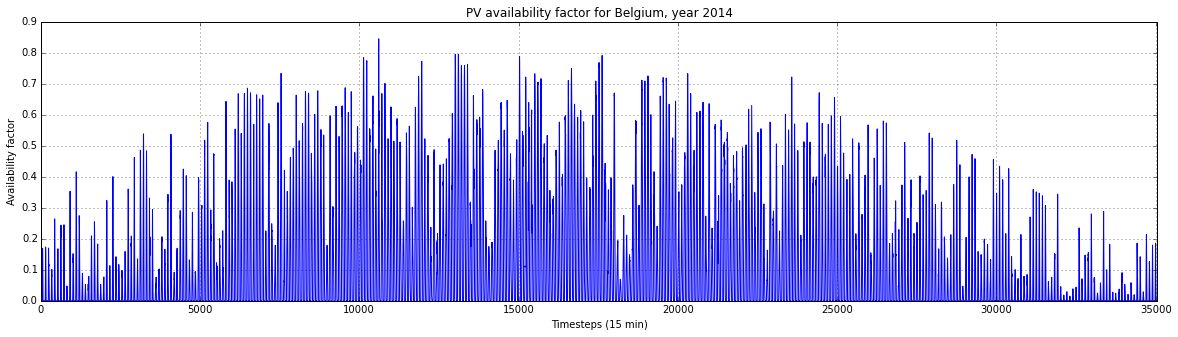
可从http://hdl.handle.net/2268/147390获得一个普通家庭的负荷概况数据。 数据时间步长为15分钟,单位为kWh。
load_data = pd.read_csv('demand.csv')/1000
load = load_data['All 4000']
TotalLoad = load.sum()/4
plt.figure(figsize=(20,5))
load.plot()
plt.ylabel('Load (kW)')
plt.xlabel('Timesteps (15 min)')
plt.title('15-min consumption for a typical dwelling in Belgium, year 2014')
Out[18]:
<matplotlib.text.Text at 0x7f93b17da810>
%matplotlib inline

PV_week = AvailabilityFactor_PV[17948:18619]*5
Demand_week = load[17948:18619]
Demand_week.name = 'Demand'
PV_week.name = 'PV production'
dates = pd.date_range(start='2014.07.07',periods=len(Demand_week),freq='15min')
Demand_week.index = dates
PV_week.index = dates

plt.figure(figsize=(20,5))
PV_week.plot(legend=True,color='red')
Demand_week.plot(legend=True,color='blue')
plt.ylabel('Load and PV production (kW)')

plt.fill_between(dates.values,PV_week.values,0,color='yellow',alpha='0.2')
Out[19]:
<matplotlib.collections.PolyCollection at 0x7f93b16faed0>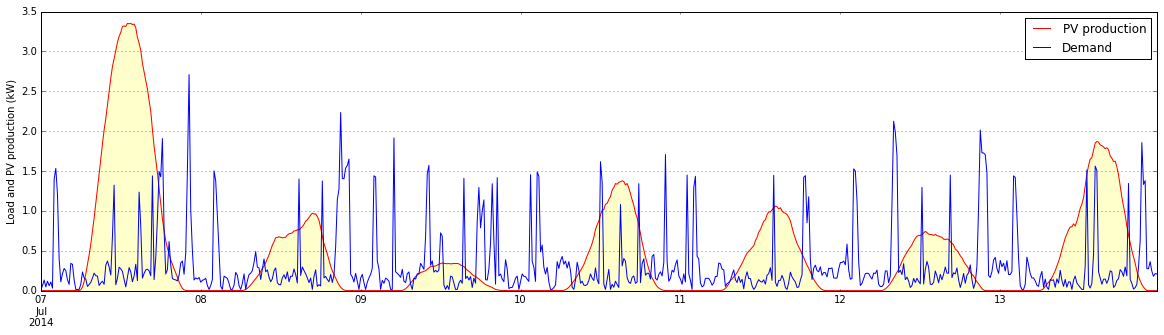
假设
电池特性对应于Tesla 7 kWh电池。 据特斯拉称,这是唯一一款专为每日循环设计的机型(10 kWh机型专为每周循环设计)
BatteryCapacity = 7 # kWh
BatteryCost = 3000*0.9   # Euros
InstallationCost = 500
StorageCost_kWh = BatteryCost/BatteryCapacity
BatteryEfficiency = 0.92
BatteryLifetime = 10    # years
InterestRate = 0.03   # The interest rate must be a real interest rat (i.e. interest rate - inflation)
假设光伏家用系统为5 kW系统,相当于年产量等于需求(5000 kWh)。
比利时屋顶光伏的平均成本假定为110EUR / MWh。 该值接近德国提出的上网电价,假定该电价很好地反映了发电成本。
PVPower = 5   # kW
LCOE_PV = 0.110   # EUR/kWh
InverterEfficiency = 0.96
年仿真
进行存储容量的分配是为了最大程度地提高自我消耗:当PV功率高于负载且只要未充满电时,电池即在充电。 只要光伏功率低于负载并且只要没有完全放电,它就会放电。 假定需求没有响应。
urllib.urlretrieve ("http://www.labothap.ulg.ac.be/notebooks/battery_storage/system.png", "system.png")
from IPython.display import Image
Image(filename='system.png')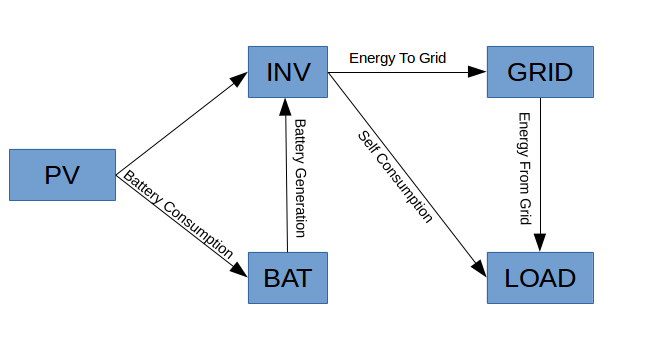
# Yearly simulation is put in a function so that we can call it back later:
def yearly_simulation(PV,load,BatteryCapacity,timestep):
    #Initialize variables:
    Nsteps = len(PV)
    LevelOfCharge = np.zeros(Nsteps)        # kWh
    EnergyFromGrid = np.zeros(Nsteps)       # kWh
    EnergyToGrid = np.zeros(Nsteps)         # kWh
    BatteryGeneration = np.zeros(Nsteps)    # kW
    BatteryConsumption = np.zeros(Nsteps)   # kW

    LevelOfCharge[0] = BatteryCapacity/2

    for i in range(1,Nsteps):
        LevelOfCharge[i] = LevelOfCharge[i-1] + (np.maximum(0,PV[i] - load[i]/InverterEfficiency) - np.maximum(0,load[i]/InverterEfficiency - PV[i])/BatteryEfficiency)*timestep
        if LevelOfCharge[i] < 0:
            EnergyFromGrid[i] = -LevelOfCharge[i] * BatteryEfficiency * InverterEfficiency
            LevelOfCharge[i] = 0
        elif LevelOfCharge[i] > BatteryCapacity:
            EnergyToGrid[i] = LevelOfCharge[i] - BatteryCapacity
            LevelOfCharge[i] = BatteryCapacity

        BatteryGeneration[i] = np.maximum(0,LevelOfCharge[i-1] - LevelOfCharge[i]) * BatteryEfficiency / timestep

    BatteryConsumption = np.maximum(0,LevelOfCharge - np.roll(LevelOfCharge,1))/timestep
    return [BatteryGeneration,BatteryConsumption,LevelOfCharge,EnergyFromGrid,EnergyToGrid]

PV = AvailabilityFactor_PV * PVPower
timestep = 0.25
[BatteryGeneration,BatteryConsumption,LevelOfCharge,EnergyFromGrid,EnergyToGrid] = yearly_simulation(PV,load,BatteryCapacity,timestep)
绘制电池的充电状态:
%matplotlib inline
plt.figure(figsize=(20,5))
plt.plot(LevelOfCharge)
plt.ylabel('State of charge (kWh)')
plt.xlabel('Timesteps (15 min)')
plt.title('State of charge of the battery')
plt.show()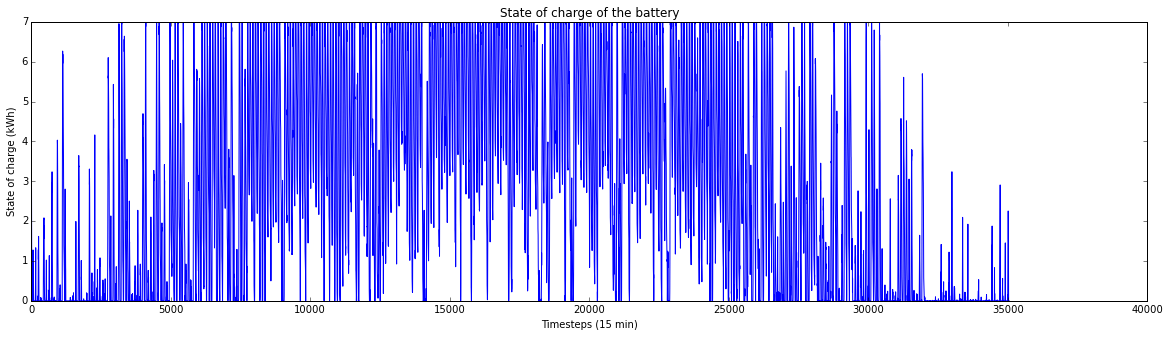
计算年度余额
TotalFromGrid = np.sum(EnergyFromGrid)
TotalToGrid = np.sum(EnergyToGrid)
TotalPV = PV.sum()/4
TotalBatteryGeneration = np.sum(BatteryGeneration/4)
TotalBatteryConsumption = np.sum(BatteryConsumption/4)
BatteryLosses = (np.sum(BatteryConsumption) - np.sum(BatteryGeneration))/4
InverterLosses = (TotalPV - BatteryLosses)*(1-InverterEfficiency)
SelfConsumptionRate = (TotalLoad - TotalFromGrid)/TotalPV*100             # in %
SelfSufficencyRate = (TotalLoad - TotalFromGrid)/TotalLoad * 100          # in %
SSR = SelfSufficencyRate
AverageDepth = np.sum(BatteryGeneration/4)/(365 * BatteryCapacity)
Nfullcycles = 365*AverageDepth

print 'Total yearly consumption: ' + str(TotalLoad) + ' kWh'
print 'Total PV production: ' + str(TotalPV) + ' kWh'
print 'Self Consumption: ' + str(TotalLoad - TotalFromGrid) + ' kWh'
print 'Self consumption rate (SCR): '  + str(SelfConsumptionRate) + '%'
print 'Self sufficiency rate (SSR): ' + str(SelfSufficencyRate) + '%'
print 'Amount of energy provided by the battery: ' + str(TotalBatteryGeneration) + ' kWh'
print 'Average Charging/Discharging depth: ' + str(AverageDepth)
print 'Number of equivalent full cycles per year: ' + str(Nfullcycles)
print 'Total battery losses: ' + str(BatteryLosses) + ' kWh'
print 'Total inverter losses: ' + str(InverterLosses) + ' kWh'

# Check residue:
#residue = TotalPV + TotalFromGrid - TotalToGrid - BatteryLosses - InverterLosses - TotalLoad
#residue = (TotalPV - BatteryLosses)*InverterEfficiency - (TotalLoad + TotalToGrid - TotalFromGrid)
#residue
Total yearly consumption: 4016.29279031 kWh
Total PV production: 5068.54186131 kWh
Self Consumption: 2807.38960783 kWh
Self consumption rate (SCR): 55.3885058987%
Self sufficiency rate (SSR): 69.900023589%
Amount of energy provided by the battery: 1531.39708414 kWh
Average Charging/Discharging depth: 0.599372635673
Number of equivalent full cycles per year: 218.771012021
Total battery losses: 133.164963839 kWh
Total inverter losses: 197.415075899 kWh
经济性
电池提供的平均1 kWh成本是通过计算电池在其整个使用寿命内产生的总能量除以投资成本得出的。
YearlyPayment = -np.pmt(InterestRate, BatteryLifetime, BatteryCost+InstallationCost)
LCOE_battery = YearlyPayment / TotalBatteryGeneration
print 'The ' + str(BatteryLifetime) + '-years levelized cost of one stored kWh is ' + str(LCOE_battery*1000) + ' EUR/MWh'
参数研究:
# Number of runs:
N = 50

# Dependent variables:
PVPower_vec = np.ones(N) * PVPower
BatteryCapacity_vec = np.ones(N) * BatteryCapacity

# Output variables
TotalFromGrid = np.zeros(N)
TotalToGrid = np.zeros(N)
TotalPV = np.zeros(N)
TotalBatteryGeneration = np.zeros(N)
TotalBatteryConsumption = np.zeros(N)
BatteryLosses = np.zeros(N)
InverterLosses = np.zeros(N)
SelfConsumptionRate = np.zeros(N)
SelfSufficencyRate = np.zeros(N)
AverageDepth = np.zeros(N)
Nfullcycles = np.zeros(N)
LCOE_battery = np.zeros(N)

CapacityMax = 20

for i in range(N):
    BatteryCapacity_vec[i] = 0.01 + float(i)/(N-1) * CapacityMax
    #PVPower_vec[i] = 4 + float(i)/(N-1) * 17
    PV = AvailabilityFactor_PV * PVPower_vec[i]
    [BatteryGeneration,BatteryConsumption,LevelOfCharge,EnergyFromGrid,EnergyToGrid] = yearly_simulation(PV,load,BatteryCapacity_vec[i],timestep)
    TotalFromGrid[i] = np.sum(EnergyFromGrid)
    TotalToGrid[i] = np.sum(EnergyToGrid)
    TotalPV[i] = PV.sum()/4
    TotalBatteryGeneration[i] = np.sum(BatteryGeneration/4)
    TotalBatteryConsumption[i] = np.sum(BatteryConsumption/4)
    BatteryLosses[i] = (np.sum(BatteryConsumption) - np.sum(BatteryGeneration))/4
    InverterLosses[i] = (TotalPV[i] - BatteryLosses[i])*(1-InverterEfficiency)
    SelfConsumptionRate[i] = (TotalLoad - TotalFromGrid[i])/TotalPV[i]*100             # in %
    SelfSufficencyRate[i] = (TotalLoad - TotalFromGrid[i])/TotalLoad * 100          # in %
    AverageDepth[i] = np.sum(BatteryGeneration)/4/(365 * BatteryCapacity_vec[i])
    Nfullcycles[i] = 365*AverageDepth[i]
    YearlyPayment = -np.pmt(InterestRate, BatteryLifetime, StorageCost_kWh*BatteryCapacity_vec[i]+InstallationCost)
    LCOE_battery[i] = YearlyPayment / TotalBatteryGeneration[i]
画图:
from mpl_toolkits.axes_grid1 import host_subplot
import mpl_toolkits.axisartist as AA
%matplotlib inline
host = host_subplot(111, axes_class=AA.Axes)
plt.subplots_adjust(right=0.75)
par1 = host.twinx()
par2 = host.twinx()
offset = 60
new_fixed_axis = par2.get_grid_helper().new_fixed_axis
par2.axis["right"] = new_fixed_axis(loc="right",
                                    axes=par2,
                                    offset=(offset, 0))
par2.axis["right"].toggle(all=True)
host.set_xlim(30, 80)
host.set_ylim(0, CapacityMax)
host.set_xlabel("Self Sufficiency Rate [%]",fontsize=28)
host.set_ylabel("Battery Capacity [kWh]",fontsize=18)
par1.set_ylabel("Levelized cost of stored energy [EUR/MWh]",fontsize=18)
par2.set_ylabel("Average daily charge/discharge depth",fontsize=18)
p1, = host.plot(SelfSufficencyRate,BatteryCapacity_vec, label="Battery Capacity")
p2, = par1.plot(SelfSufficencyRate[2:],LCOE_battery[2:]*1000, label="Levelized cost of storage")
p3, = par2.plot(SelfSufficencyRate,np.minimum(0.97,AverageDepth), label="Average charge/discharge depth")
par1.set_ylim(150, 750)
#par2.set_ylim(1, 65)
host.legend(title='Typical Belgian Household \nYearly consumption: ' + str(int(TotalLoad)) + ' kWh\nPV system: ' + str(PVPower) + ' kWp \nBattery cost: ' + str(int(StorageCost_kWh)) + ' EUR/kWh' ,loc='upper left',fontsize=10)
host.axis["left"].label.set_color(p1.get_color())
par1.axis["right"].label.set_color(p2.get_color())
par2.axis["right"].label.set_color(p3.get_color())
host.fill_between((30,34),0,2200,alpha=0.1,color='b')
host.fill_between((44,72),0,2200,alpha=0.1,color='b')
host.text(31.5,11,'No Battery', rotation=90,fontsize=11)
host.text(39,12,'Hourly variations', rotation=90,fontsize=11)
host.text(55,11.5,'Day/night', rotation=90,fontsize=11)
host.text(60,11.5,'variations', rotation=90,fontsize=11)
host.text(76,13,'Longer variations', rotation=90,fontsize=11)
host.vlines(69.5,0,1000,linestyle='dashed',alpha=0.3)
host.hlines(7,0,69.5,linestyle='dashed',alpha=0.3)
host.text(68,18,'Tesla',fontsize=11)
host.text(67,17,'Powerwall',fontsize=11)
host.text(50,6.8,'Tesla Powerwall', fontsize=11)
plt.title('Battery storage characteristics vs required autonomy level')
©版权声明:本文内容由互联网用户自发贡献,版权归原创作者所有,本站不拥有所有权,也不承担相关法律责任。如果您发现本站中有涉嫌抄袭的内容,欢迎发送邮件至: www_apollocode_net@163.com 进行举报,并提供相关证据,一经查实,本站将立刻删除涉嫌侵权内容。
转载请注明出处: apollocode » 评估蓄电池的价值以平衡屋顶光伏发电
文件列表(部分)
| 名称 | 大小 | 修改日期 |
|---|---|---|
| demand.csv | 286.74 KB | 2015-07-17 |
| Home_Batteries.html | 442.19 KB | 2015-07-17 |
| Home_Batteries.ipynb | 413.78 KB | 2015-07-17 |
| solar_data.csv | 225.68 KB | 2015-07-17 |
| system.png | 28.59 KB | 2015-07-17 |
| home_batteries | 0.00 KB | 2015-07-17 |

发表评论 取消回复